
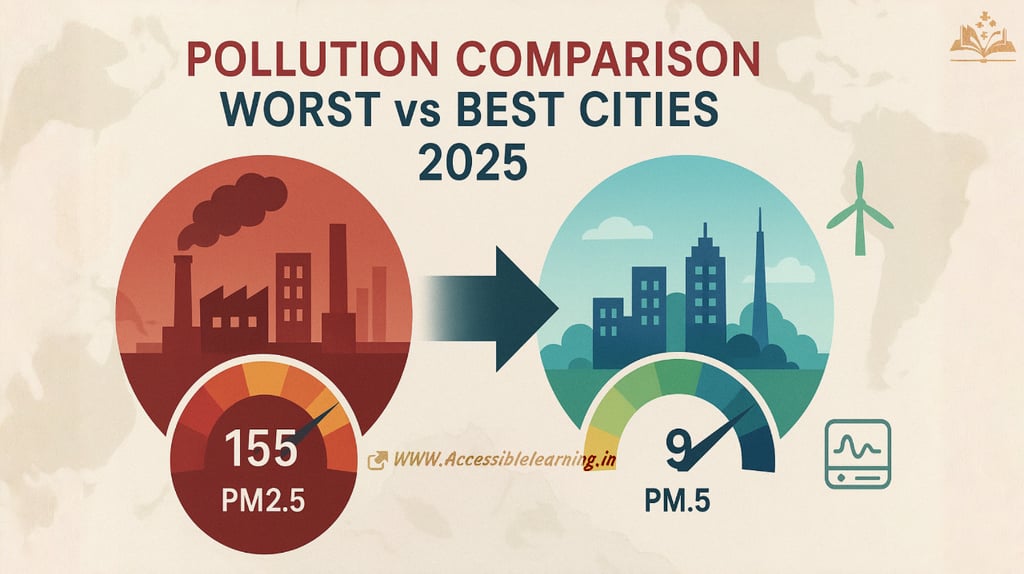
Top 10 Most Polluted vs 99% Pollution-Free Cities Worldwide
Compare the world's most polluted cities with the cleanest air quality destinations. Learn causes, solutions, and strategies for urban air quality.
ENVIRONMENTHARSH REALITYGLOBAL ISSUES
Kim Shin / Keshav Jha
7/10/20255 min read
Top 10 Most Polluted Cities (2025)
Based on current air quality data and PM2.5 concentrations, these cities represent the most severe pollution challenges globally:
1. Byrnihat, India
PM2.5 Concentration: 128.2 µg/m³ (25x WHO limit)
Why: Industrial hub with unregulated manufacturing, brick kilns, and coal-fired power plants. Limited environmental enforcement allows unchecked emissions from cement factories and chemical plants.
How it happened: Rapid industrialization without corresponding environmental infrastructure. Lack of emission controls and proximity to mining operations create toxic air conditions.
2. New Delhi, India
PM2.5 Concentration: 110+ µg/m³
Why: Vehicle emissions, construction dust, crop burning, and thermal power plants. A population density of 30+ million compounds the problem.
How it happened: Explosive urban growth without adequate public transport. Seasonal crop burning in surrounding states and inadequate waste management systems exacerbate pollution levels.
3. Lahore, Pakistan
PM2.5 Concentration: 105+ µg/m³
Why: Industrial emissions, vehicular pollution, and cross-border smog from India. Coal-fired power plants and textile manufacturing create persistent air quality issues.
How it happened: Rapid industrialization combined with poor urban planning. Lack of emission standards and inadequate environmental monitoring systems.
4. Dhaka, Bangladesh
PM2.5 Concentration: 95+ µg/m³
Why: Brick kilns, vehicular emissions, and industrial waste. Dense population with limited green spaces and inadequate waste management infrastructure.
How it happened: Uncontrolled urban expansion with minimal environmental regulations. Construction boom without dust control measures.
5. Karachi, Pakistan
PM2.5 Concentration: 90+ µg/m³
Why: Port city with heavy industrial activity, vehicular pollution, and dust storms. Oil refineries and chemical industries contribute significantly.
How it happened: Industrial development without environmental safeguards. Coastal location traps pollutants during certain weather conditions.
6. Beijing, China
PM2.5 Concentration: 85+ µg/m³
Why: Coal combustion, industrial emissions, and vehicle exhaust. Sandstorms from the Gobi Desert add to particulate matter levels.
How it happened: Decades of coal-dependent economic growth with limited environmental controls. Geography that traps pollutants in the city basin.
7. Mumbai, India
PM2.5 Concentration: 80+ µg/m³
Why: Dense population, vehicular emissions, industrial activity, and construction dust. Slum areas with open burning contribute to pollution.
How it happened: Rapid urbanization without infrastructure development. High population density concentrates emission sources.
8. Kolkata, India
PM2.5 Concentration: 78+ µg/m³
Why: Industrial emissions, vehicular pollution, and seasonal crop burning. Coal-fired power plants and manufacturing facilities create persistent pollution.
How it happened: Historical industrial development with outdated emission controls. Geographic location traps pollutants during winter months.
9. N'Djamena, Chad
PM2.5 Concentration: 75+ µg/m³
Why: Dust storms, vehicular emissions, and oil industry activities. Desert location creates natural dust pollution combined with industrial emissions.
How it happened: Oil industry development without environmental regulations. Desert climate creates challenging conditions for pollution dispersal.
10. Ulaanbaatar, Mongolia
PM2.5 Concentration: 70+ µg/m³
Why: Coal burning for heating, thermal power plants, and ger (yurt) districts burning raw coal. Extreme cold requires intensive heating.
How it happened: Soviet-era infrastructure dependent on coal combined with informal settlements using unprocessed coal for heating.


Top 10 Cities with 99% Pollution-Free Air Quality
These cities maintain exceptional air quality through comprehensive environmental policies and natural advantages:
1. Zürich, Switzerland
PM2.5 Concentration: 5-8 µg/m³
Why: Strict environmental regulations, excellent public transport, a renewable energy focus, and geographic advantages with Alpine winds.
How they achieved it: Comprehensive emission controls, investment in clean energy, efficient public transportation, and rigorous industrial standards.
2. Helsinki, Finland
PM2.5 Concentration: 6-9 µg/m³
Why: Clean energy infrastructure, efficient urban planning, extensive green spaces, and Baltic Sea location providing natural air circulation.
How they achieved it: District heating systems, renewable energy adoption, strict building codes, and comprehensive environmental monitoring.
3. Vancouver, Canada
PM2.5 Concentration: 7-10 µg/m³
Why: Coastal location with Pacific Ocean winds, hydroelectric power, stringent emission standards, and extensive green infrastructure.
How they achieved it: Clean energy policies, public transit investment, building efficiency standards, and natural geographic advantages.
4. Sydney, Australia
PM2.5 Concentration: 8-11 µg/m³
Why: Coastal location with ocean breezes, renewable energy adoption, strict environmental regulations, and extensive green spaces.
How they achieved it: Clean air legislation, renewable energy transition, public transport development, and natural wind patterns.
5. Wellington, New Zealand
PM2.5 Concentration: 6-9 µg/m³
Why: Constant wind patterns, renewable energy dominance, small population, and geographic isolation from major pollution sources.
How they achieved it: Clean energy policies, efficient public transport, strict emission standards, and natural wind circulation.
6. Stockholm, Sweden
PM2.5 Concentration: 7-10 µg/m³
Why: District heating systems, renewable energy focus, congestion pricing, and extensive green infrastructure throughout the city.
How they achieved it: Carbon tax implementation, clean energy transition, efficient public transport, and comprehensive urban planning.
7. Copenhagen, Denmark
PM2.5 Concentration: 8-11 µg/m³
Why: Bicycle-friendly infrastructure, renewable energy adoption, district heating systems, and coastal location with natural air circulation.
How they achieved it: Cycling infrastructure investment, clean energy policies, efficient heating systems, and environmental regulations.
8. Oslo, Norway
PM2.5 Concentration: 6-9 µg/m³
Why: Hydroelectric power, electric vehicle adoption, efficient public transport, and geographic location with natural air circulation.
How they achieved it: Clean energy policies, electric vehicle incentives, public transport investment, and strict emission standards.
9. Reykjavik, Iceland
PM2.5 Concentration: 5-8 µg/m³
Why: Geothermal energy, small population, minimal industrial activity, and constant Atlantic winds providing natural air purification.
How they achieved it: Geothermal energy utilization, minimal industrial development, natural geographic advantages, and environmental protection policies.
10. Geneva, Switzerland
PM2.5 Concentration: 7-10 µg/m³
Why: Strict environmental regulations, excellent public transport, a renewable energy focus, and the Lake Geneva location providing natural air circulation.
How they achieved it: Comprehensive emission controls, clean energy adoption, efficient public transportation, and rigorous environmental monitoring.


Key Factors Creating Pollution vs Clean Air
Major Pollution Causes
Industrial Emissions: Unregulated manufacturing and power generation
Vehicle Exhaust: Dense traffic without emission controls
Coal Combustion: Heating and power generation using coal
Construction Activities: Dust and particulate matter from building projects
Geographic Factors: Basins and valleys that trap pollutants
Seasonal Burning: Agricultural and waste burning practices
Clean Air Success Factors
Renewable Energy: Hydroelectric, geothermal, and wind power
Public Transportation: Efficient systems reducing vehicle emissions
Environmental Regulations: Strict emission standards and enforcement
Geographic Advantages: Coastal locations and natural wind patterns
Green Infrastructure: Parks, trees, and sustainable urban planning
Economic Policies: Carbon pricing and clean energy incentives
The Pollution Divide
The contrast between these cities illustrates the critical importance of environmental policy, economic development approaches, and geographic factors in determining air quality. While the most polluted cities struggle with rapid industrialization and inadequate environmental controls, the cleanest cities demonstrate that economic prosperity and environmental protection can coexist through strategic planning and policy implementation.
The challenge for polluted cities lies in balancing economic development with environmental protection, requiring significant investment in clean technologies and infrastructure. The success of clean cities provides models for sustainable urban development that other cities can adapt to their specific circumstances and resources.
Subscribe To Our Newsletter
All © Copyright reserved by Accessible-Learning Hub
| Terms & Conditions
Knowledge is power. Learn with Us. 📚

